Point clouds constructed from aerial images using digital photogrammetry (DAP) have gained substantial attention for the purpose of forest inventories, mainly because the acquisition of images is less costly than acquiring airborne laser scanning (ALS) data. However, studies have indicated that estimated forest characteristics using DAP point clouds are less precise compared to those estimated by means of ALS point clouds. The trade-offs between precision and cost-effectiveness may still render DAP a viable alternative for certain applications in forest inventory. With a multitude of possible combinations of image qualities and software for processing, care should be taken before implementing DAP point clouds in forest inventory pipelines. This SmartForest task has systematically tested the accuracy and precision of modelling forest characteristics using metrics representing point clouds constructed using five different software tools for matching images. The results were compared to the results obtained by using ALS metrics.
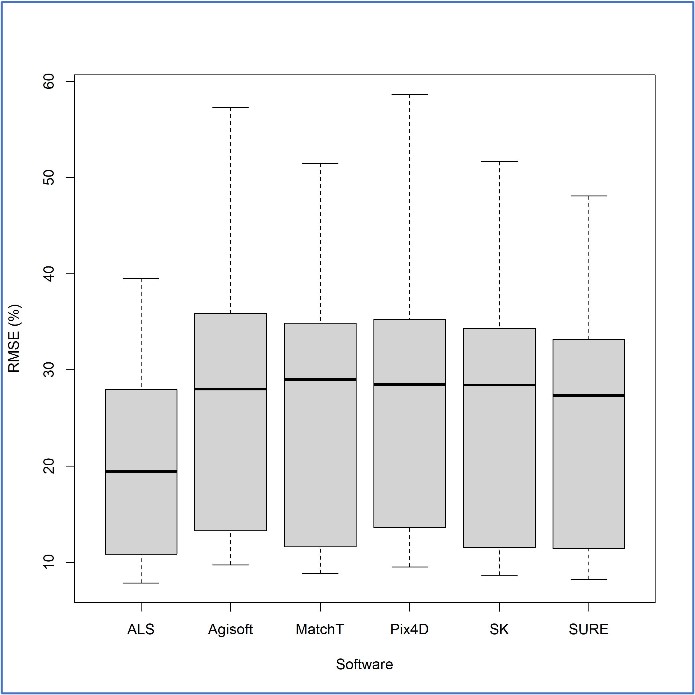
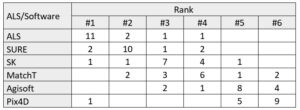
For different modelling alternatives, the root mean square error (RMSE) between field reference values of stand basal area, volume, Lorey’s mean height, dominant height, and number of stems, and corresponding model fitted values (model residuals), was on average smaller using ALS (median RMSE ≈ 20%) compared to all models based on metrics obtained by all DAP-software packages (median RMSE ≈ 30%). The results are illustrated in Figure 1, displaying the distributions of the relative RMSEs for 15 models (5 forest characteristics, 3 strata) based on each of the different point clouds analyzed. ALS was ranked as number 1 in terms of RMSE (smallest RMSE), 11 of 15 times, most often followed by data extracted using the DAP-software SURE (Table 1). The results also indicate (not displayed) that the different DAP point clouds yielded RMSE values closer to ALS for the height characteristics compared to the other characteristics.
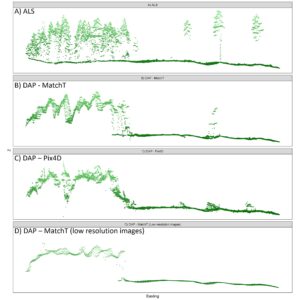
Breaking the results down to the level of each characteristic also shows that DAP point clouds yield results with larger variation. There were also several field plots used in this study, for which several of the DAP software packages were not able to create point clouds at all. There were also clear differences related to image quality. Figure 2 displays cross sections of three DAP point clouds (lower three) matched using different software and image quality, and an ALS point cloud (upper). Panel B and D both display point clouds from using Match T, but with different image quality, with a striking visual difference. Differences are also clearly visible between software and ALS (panels A-C).
Considering that the demand for forest inventories to provide more detailed information in the future, for example height variation and crown lengths in relation to continuous cover forestry, we still consider that ALS is the more reliable source of remotely sensed data.
This work was conducted as part of SmartForest WP1 at NMBU with Hans Ole Ørka, Erik Næsset, Terje Gobakken and Ole Martin Bollandsås in collaboration with NIBIO, Field, AT Skog, Glommen Mjøsen Skog, Viken Skog og Statens Kartverk.